Distributed Tracing
Hi, me and my colleague Yağızhan Kerim Değer will try to give you information about distributed tracing. You can access the Turkish version of the article at https://medium.com/@yagizhankerim/distributed-tracing-7b43b45a72b9
Distributed Tracing
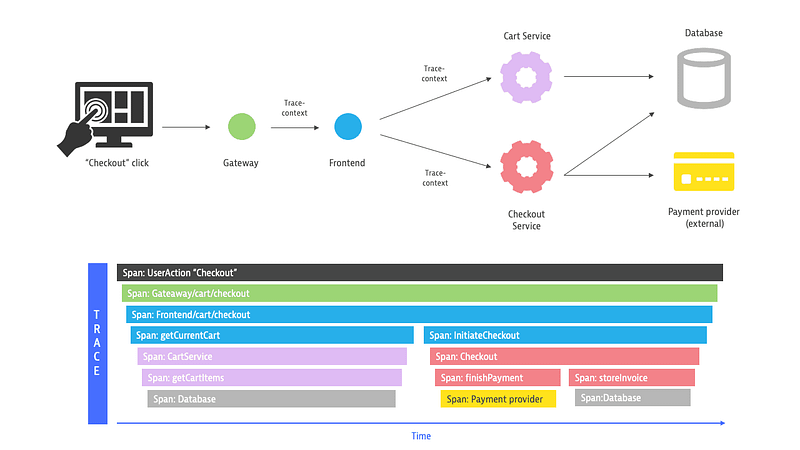
Distributed Tracing traces the flow of a system from frontend devices to backend services and the database level, providing telemetry data. This data can help detect performance issues in different components of an application, as well as identify their root causes.
In this technique, there is a trace and span structure to ensure tracking. Trace shows us the path that a request follows between all services it passes through. Also, each trace has an ID and spans are contained within the trace. A span represents different parts of the request. For example, a request made from Service A can be defined as a span. The message that will be sent to Kafka as a result of this request can be a different span, consuming this message by Service B can be a different span, and performing a DB operation as a result of this can be evaluated as a different span. The data in the spans can include information such as the start and end times of the process, which components are involved in the process, which process steps are taken, how long it takes to complete which process steps, and which errors occur. This data can be used to monitor the application’s performance and detect performance issues.
Distributed tracing systems are typically used in heavy processing, large-scale applications, and microservices. These systems are designed to track transactions between different components of an application and are very useful for monitoring application performance.
Advantages:
Reducing MTTD (Mean Time to Detect) and MTTR (Mean Time to Resolve) times: Distributed tracing provides complete flow visibility, helping to reduce the time spent identifying and solving the main causes of encountered problems.
Learning System Architecture: Thanks to distributed tracing, we get detailed information about which services are communicating with each other. This information helps us optimize system performance.
Inter-Team Collaboration and Increased Productivity: In microservice architecture, different teams can communicate with each other to perform a request. Thanks to Distributed Tracing, we can see which team is responsible for errors and which team is responsible for solving them.
Disadvantages:
Manual Instrumentation: In distributed tracing, you need to manually add code to your application to start tracing requests, which can consume time.
I will give you information about some distributed tracing tools.
Open Tracing
A system needs to be instrumented to make it observable. OpenTelemetry is an open source project aimed at making systems more observable. To achieve this, the code needs to emit traces, metrics, and logs. In the past, there was a lack of standardization because different observability tools used different libraries. To address this, two open source projects were created: OpenTracing, which was a Cloud Native Computing Foundation (CNCF) project that provided an API for sending telemetry data to an observability tool, and OpenCensus, which was a Google open source community project that provided a set of language-specific libraries that developers could use to instrument their code and submit it to any of the supported observability tools. These two projects were merged in May 2019 under the name OpenTelemetry (OTel), creating a single standard.
Jaeger

Jaeger is an open source distributed tracing tool inspired by Dapper and OpenZipkin, created by Uber Technologies and donated to CNCF. Its advantages include being a free tool with an easy-to-use UI, supported and developed by a large community, and it offers support for many different programming languages. It can also easily integrate with Kubernetes and other cloud-based environments. However, it may cause performance issues for large-scale systems.
Zipkin
Zipkin is another open source distributed tracing tool that has support for many different programming languages. It has basic features such as a UI, data storage, and query tools. It was developed by Twitter in 2010 and handed over to the open source community in 2016 under the name OpenZipkin. Its advantages include being a free tool with an easy-to-use UI, and support for many different programming languages. However, integration with Kubernetes and other cloud-based environments can be difficult and it may cause performance issues for large-scale systems.
AppDynamics
AppDynamics is a distributed tracing tool for large-scale systems, but it is a paid tool. Its advantages include excellent performance for high-scale systems, a rich UI, and advanced analysis features. However, it is costly to use and not open source.
Datadog
Datadog is a scalable distributed tracing tool that offers a UI, analysis, and alarm features, and can integrate with other monitoring tools. Its advantages include being scalable and suitable for large-scale systems, having an easy-to-use UI, and easy integration with other monitoring tools. However, it is also a paid tool and not open source.
AWS X-Ray
AWS X-Ray is a distributed tracing tool for AWS-based applications that provides full integration with other AWS tools and offers UI, analysis, and reporting features. Its advantages include being a distributed tracing tool suitable for AWS-based applications, providing full integration with other AWS tools, and having an easy-to-use UI. However, it is only available for AWS-based applications, and integration with other tools is somewhat limited.
Sources
[Distributed tracing by PurePath® technology
A core feature of Dynatrace, PurePath® distributed traces combine distributed tracing with code-level visibility…www.dynatrace.com](https://www.dynatrace.com/support/help/observe-and-explore/purepath-distributed-traces "https://www.dynatrace.com/support/help/observe-and-explore/purepath-distributed-traces")
[What is Distributed Tracing? How it Works & Use Cases | Datadog
Distributed tracing is a method of tracking application requests as they flow from frontend devices to backend services…www.datadoghq.com](https://www.datadoghq.com/knowledge-center/distributed-tracing/ "https://www.datadoghq.com/knowledge-center/distributed-tracing/")
[Jaeger Tracing: The Ultimate Guide | Aspecto
In this guide, you'll learn what Jaeger tracing is, what distributed tracing is, and how to set it up in your system…www.aspecto.io](https://www.aspecto.io/blog/jaeger-tracing-the-ultimate-guide/ "https://www.aspecto.io/blog/jaeger-tracing-the-ultimate-guide/")


